
LW-ICFI LogisticsWall Indian Container Freight Index for Ocean Exports – September 2026

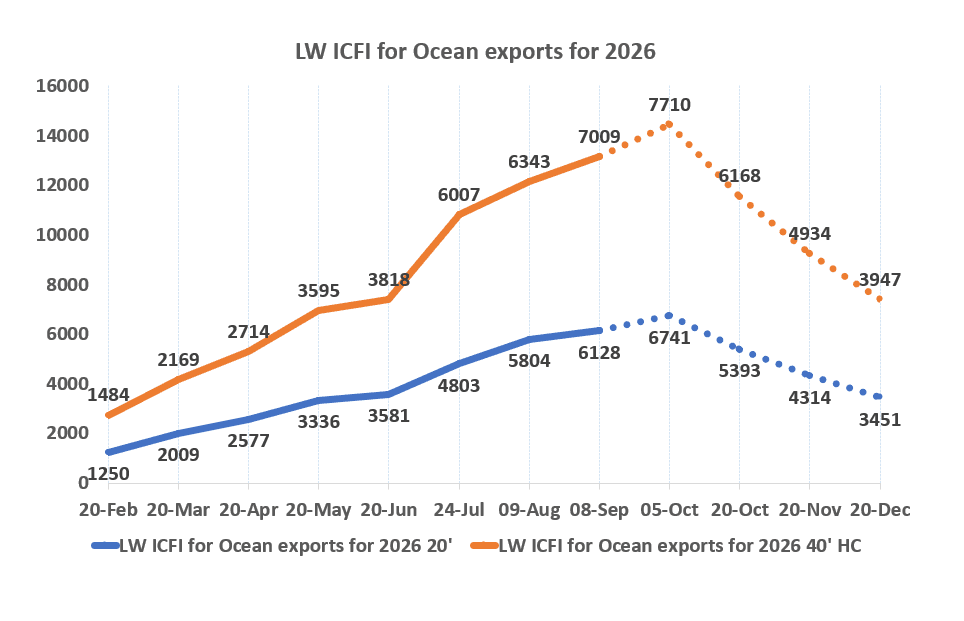
India's container export freight market has moved higher again in September, with the LogisticsWall Indian Container Freight Index (LW-ICFI) reaching USD 6,128 per 20GP container and USD 7,009 per 40'/40HC container on 8 September 2026.
The increase is not limited to one trade lane. Freight has moved higher across the major export markets, while the Middle East is facing a particularly difficult operating environment because of vessel delays and port congestion.
Compared with the previous LW-ICFI assessment of 9 August, the 20GP index has increased by around 5.6%, while the 40'/40HC index has increased by around 10.5%.
The movement becomes even clearer when the index is viewed from February.
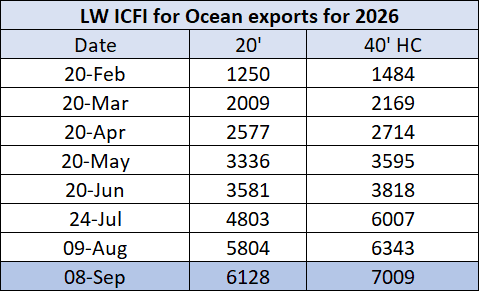
From February to September, the LW-ICFI has increased by almost 390% for 20GP and more than 370% for 40'/40HC.
This is a very different market from the beginning of the year. The pressure is now coming from several directions at the same time — Middle East disruption, vessel bunching, port congestion, equipment imbalance and increasing pressure on available vessel space.
Trade lane assessment
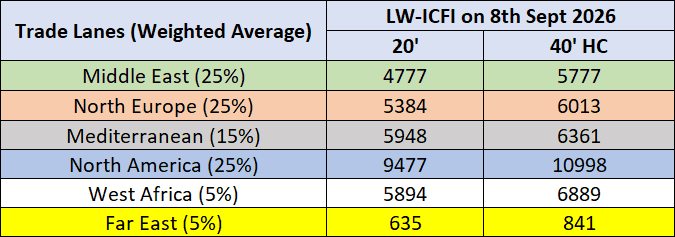
On the trade-lane front, North America continues to remain the highest-priced trade, with the weighted average at USD 9,477 for 20' and USD 10,998 for 40' HC. Mediterranean and West Africa are also higher at USD 5,948 / USD 6,361 and USD 5,894 / USD 6,889 respectively, while North Europe stands at USD 5,384 for 20' and USD 6,013 for 40' HC. The Middle East weighted average is comparatively lower at USD 4,777 / USD 5,662, although the trade is facing severe congestion and vessel turnaround delays. Far East remains the lowest at USD 635 / USD 841. Overall, the trade-lane assessment shows continued pressure on long-haul exports, with North America remaining the key driver of higher freight levels.
Middle East has become the biggest pressure point
The Middle East is showing the sharpest operational problems in the latest assessment.
For Jebel Ali, freight has increased by approximately USD 1,000 per container compared with the previous assessment.
At Jeddah, freight has increased by approximately USD 1,000–1,500 per container, with congestion playing a major role.
The only major exception is Sohar, where freight has reduced by approximately USD 300 per container.
But lower freight at Sohar does not mean that the overall Middle East market has normalised.
The bigger problem is vessel turnaround.
Current market feedback indicates that vessels calling at major Middle East ports are facing approximately 20–25 days of waiting/turnaround time in some cases. Such delays do not remain restricted to the vessel that is waiting. They affect the next rotation, equipment positioning, empty container evacuation and the availability of vessels for subsequent Indian sailings.
This creates a cycle where a vessel arriving late at the Middle East can also return late to India, miss its next schedule and reduce the effective capacity available to exporters.
Freight is also rising towards Europe and the USA
The pressure is not restricted to Middle East cargo.
Freight has also increased on the USA and Europe trades, where long-haul vessel capacity remains under pressure.
This is important because the Indian export market is now facing a situation where Middle East disruption is affecting vessel networks, while congestion and capacity management on long-haul services are simultaneously keeping freight rates elevated.
For exporters, the problem is therefore no longer simply the freight quotation.
The bigger question is whether the container can get the required equipment and space on the required sailing.
China congestion adds another risk
Another major risk for September and October is coming from China.
Typhoon-related disruption has already affected major Chinese container gateways. Shanghai and Ningbo have experienced significant vessel delays following repeated weather disruptions, while accumulated vessel bunching and yard pressure are taking time to clear. Recent industry reporting has put waiting times at some Shanghai and Ningbo terminals at around 10 days.
Kuehne+Nagel's latest port update also reported continuing congestion at Shanghai and Ningbo following Typhoon Saudel, including temporary terminal closures and high yard utilisation.
The concern for Indian exporters is the knock-on effect.
When vessels are delayed in China, the next Indian call can also be delayed. The same vessel may arrive late in India, sail late towards Europe or the Middle East and return late for its next rotation.
At the same time, delayed vessel departures can hold containers and equipment at origin, creating an empty-container imbalance in other markets.
With September and October traditionally being important export months for China, another major cyclone or typhoon-related disruption could therefore add another layer of congestion to an already stretched network.
Global space congestion and empty equipment
The market is increasingly showing signs of a global capacity problem rather than an India-only freight increase.
Vessel delays at major hubs, disrupted rotations and port congestion are effectively removing available capacity from the schedule even when the physical number of vessels has not changed.
The result is a familiar chain:
Port congestion → vessel delay → missed rotation → reduced effective capacity → space shortage → equipment imbalance → higher freight.
This is why the September LW-ICFI increase needs to be viewed together with the LogisticsWall assessment of export space availability.
A container may be available for booking, but that does not necessarily mean the exporter will get the preferred sailing, equipment or transit time.
LW-ICFI trend
The September assessment shows how quickly the Indian export freight market has moved during 2026.
The 20GP index has moved from USD 1,250 in February to USD 6,128 in September.
The 40'/40HC index has moved from USD 1,484 to USD 7,009 during the same period.
The latest movement is particularly important because the increase is happening after freight had already reached elevated levels in July and August.
The market is therefore entering September with a much higher freight base, while operational risks remain elevated.
What the September index means for exporters
The September LW-ICFI indicates that Indian exporters are entering a market where freight and reliability are becoming equally important.
Higher freight to Jebel Ali and Jeddah, 20–25 day vessel turnaround issues in parts of the Middle East, rising Europe and USA freight, and congestion in China are all connected through the same global vessel and equipment network.
The biggest risk now is that another major disruption — particularly another cyclone affecting Chinese ports — could further tighten vessel space and create another round of equipment shortages.
For exporters, waiting for freight to fall may therefore not always be the best strategy.
The market is increasingly about securing space + equipment + sailing reliability, rather than simply finding the lowest freight.
How LW-ICFI is calculated
LW-ICFI the Indian Container Freight Index for ocean exports follows a transparent, multi-stage weighted average methodology designed to reflect the structure of India's export container market.
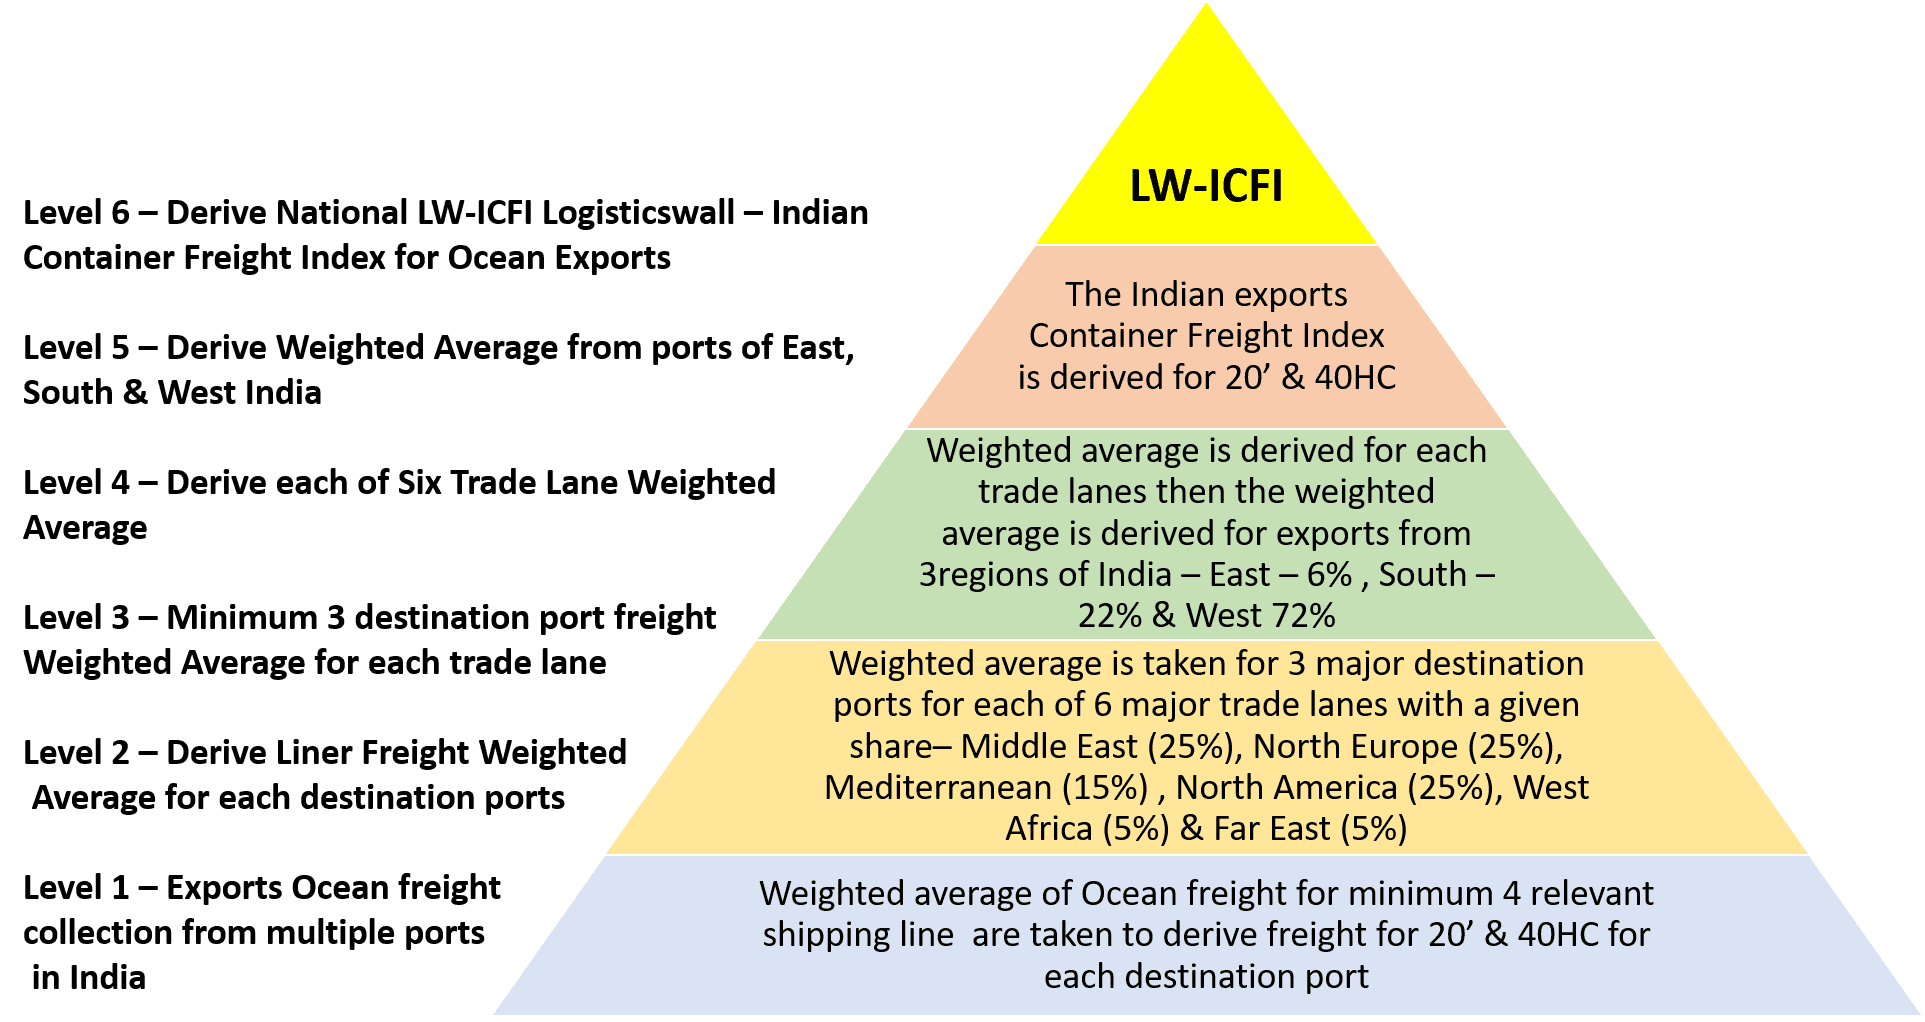
The benchmark is derived through:
Freight collection from multiple shipping lines, NVOCCs and market participants.
Regional weighted averages based on India's major export gateways.
Destination port weightages within each trade lane.
Trade lane weightages reflecting India's export distribution.
Consolidation into separate national benchmarks for 20GP and 40'/40HC containers.
Regional weightages
Region | Weight |
West India | 72% |
South India | 22% |
East India | 6% |
The regions include below ports and the weighted average share has been derived on basis of container handled by each port (to get monthly port traffic data please click here - https://logisticswall.com/category/blog/march-and-april-2026-indian-ports-container-handling-and-traffic-data)
East India share of 6% includes ports of Kolkata / Haldia / Paradip / Visakhapatnam / Gangavaram
South India share of 22% includes ports of Kattupalli / Chennai / Tuticorin / Ennore / Kakinada / Cochin / Vizhinjam
West India share of 72% includes ports of Pipavav / Hazira / Mundra / Kandla / Nhava Sheva / Mangalore
Trade lane weightages
Trade Lane | Weight |
Middle East | 25% |
North Europe | 25% |
North America | 25% |
Mediterranean | 15% |
West Africa | 5% |
Far East | 5% |
The benchmark incorporates freight assessments from representative Indian export gateways and major destination ports, using weighted averages to reflect prevailing market conditions. Freight quotations from leading shipping lines, NVOCCs and other market participants are consolidated through a structured methodology to produce a single national benchmark for each equipment type.
About LW-ICFI
The LogisticsWall Indian Container Freight Index (LW-ICFI) is an independent benchmark developed to measure prevailing container freight rates for India's export trade.
The benchmark is published separately for 20GP and 40'/40HC containers in USD per container and is intended to provide exporters, shipping lines, freight forwarders, logistics service providers, financial institutions, researchers and policymakers with a transparent reference for monitoring changes in Indian export freight markets.
The methodology will be reviewed periodically to ensure that the benchmark continues to reflect evolving trade patterns while maintaining consistency and comparability across reporting periods.
Just for better clarity below is an example how the index is derived for Middle East
Trade lanes ( Wtd. Avg) | Destinations(Wtd. Avg) | Line (Wtd avg %) | East India | South India | West India | |||
20' | 40' HC | 20' | 40' HC | 20' | 40' HC | |||
Middle East(25%) | Jebel Ali(40%) | MSC(20%) | 5563 | 6563 | 5363 | 6363 | 4563 | 5563 |
Maersk(10%) | 6000 | 7000 | 5800 | 6800 | 5000 | 6000 | ||
CMA)13%) | 5800 | 6800 | 5600 | 6600 | 4800 | 5800 | ||
Others (57%) | 6200 | 7200 | 6000 | 7000 | 2700 | 3700 | ||
Sohar(10%) | MSC(20%) | 3363 | 4363 | 3163 | 4163 | 2363 | 3363 | |
Maersk(10%) | 4300 | 5300 | 4100 | 5100 | 3300 | 4300 | ||
CMA)13%) | 4250 | 5250 | 4050 | 5050 | 3250 | 4250 | ||
Others (57%) | 4400 | 5400 | 4200 | 5200 | 3400 | 4400 | ||
Jeddah(50%) | MSC(20%) | 7013 | 8013 | 6813 | 7813 | 6513 | 7513 | |
Maersk(10%) | 7500 | 8500 | 7300 | 8300 | 6500 | 7500 | ||
CMA)13%) | 7700 | 8700 | 7500 | 8500 | 6700 | 7700 | ||
Others (57%) | 7500 | 8500 | 7300 | 8300 | 3500 | 4500 | ||
For Middle East the major ports included are Jebel Ali / Sohar /Jeddah ( as other port movement is hindered now due to war in strait of Hormuz)
Below freight index details of each destination port was derived from different regions of India
Ports( Wtd. Avg) | East India (6%) | South India(22%) | West India(72%) | |||
Destinations(Wtd. Avg) | 20' | 40' HC | 20' | 40' HC | 20' | 40' HC |
Jebel Ali(40%) | 6001 | 7001 | 5801 | 6801 | 3576 | 4576 |
Sohar(10%) | 4163 | 5163 | 3963 | 4963 | 3163 | 4163 |
Jeddah(50%) | 7429 | 8429 | 7229 | 8229 | 4819 | 5819 |
For Middle East the freight index from different Indian regions was derived as destination port weighted average
Ports (Wtd. Avg) | East India (6%) | South India(22%) | West India(72%) | |||
20' | 40' HC | 20' | 40' HC | 20' | 40' HC | |
Middle East | 6531 | 7531 | 6331 | 7331 | 4156 | 5156 |
After taking share of weighted average of each Indian port the Index for Middle East and other trade lanes were arrived for 20’ & 40HC/40’ with below data and the all trade data is mentioned above in trade lane assessment.
As explained above after taking the weighted average of all the trade lanes the Indian Container freight index is derived with below data
LW-ICFI on 08-09-2026 | ||
Date | 20' | 40' HC |
08-09-2026 | 6128 | 7009 |
Regional freight normalisation methodology
Freight rates vary slightly between Indian ports within the same region due to differences in terminal charges, feeder connectivity, vessel calls and market dynamics. To ensure that the LW-ICFI accurately reflects regional freight levels, appropriate freight adjustments have been applied where necessary.
East India
Freight from Paradip is generally USD 50 per container higher than Kolkata/Haldia.
Freight from Visakhapatnam (Vizag) and Gangavaram is typically USD 50 per container higher than Paradip.
These adjustments apply to both 20GP and 40'/40HC containers.
West India
Freight rates from Mundra and Nhava Sheva (JNPA) are generally comparable for long-haul trade lanes such as Europe, North America and Africa.
For Middle East destinations, freight from Mundra is typically USD 50–100 per container lower than Nhava Sheva for both 20GP and 40'/40HC containers.
South India
Freight from Tuticorin (V.O. Chidambaranar Port) and Cochin is generally USD 50–100 per container higher than Chennai and Kattupalli for long-haul trade lanes.
These adjustments apply to both 20GP and 40'/40HC containers.
Methodological notes
40' or 40HC freight represents both 40-foot General Purpose (40GP) and 40-foot High Cube (40HC) containers, as market freight levels for these equipment types are mostly same.
Freight rates for Antwerp and Rotterdam are considered substantially similar for the purpose of the index and are treated accordingly in the weighted-average calculations.
The index uses representative major Indian ports as reference gateways. Freight levels for nearby ports with similar market characteristics are derived from these representative ports using appropriate regional adjustments.
These normalisation adjustments are based on prevailing market observations and are applied solely to ensure that the LW-ICFI reflects representative freight levels across India's principal export regions.
September takeaway
The Indian export container market has moved into a new phase.
Freight is higher, vessel turnaround is longer, space is tighter and equipment availability is becoming a bigger concern.
The Middle East remains the immediate pressure point, particularly Jebel Ali and Jeddah, while the developing congestion in China creates a second risk for the coming weeks.
If Chinese ports face another major weather disruption during the peak export period, the impact may not remain limited to China. The resulting vessel delays and equipment imbalance could be felt across India, Europe, the Middle East and the USA.
The September LW-ICFI therefore reflects more than just higher freight.
It reflects a global container network operating with very little room for further disruption.
Popular Posts

Explore Topics



Comments