
LogisticsWall Indian Container Freight Index (LW-ICFI)

LogisticsWall Indian Container Freight Index (LW-ICFI)
LW-ICFI: Indian export container freight rates surge as LogisticsWall launches India's first dedicated container freight benchmark
20GP freight climbs 37.1% and 40'/40HC rates rise 26.4% in less than a month.
The LogisticsWall Indian Container Freight Index (LW-ICFI), India's first dedicated benchmark tracking export container freight rates for both 20’ and 40’ /40 ‘ HC containers, indicates a sharp increase in export freight rates across major trade lanes during the past four weeks.
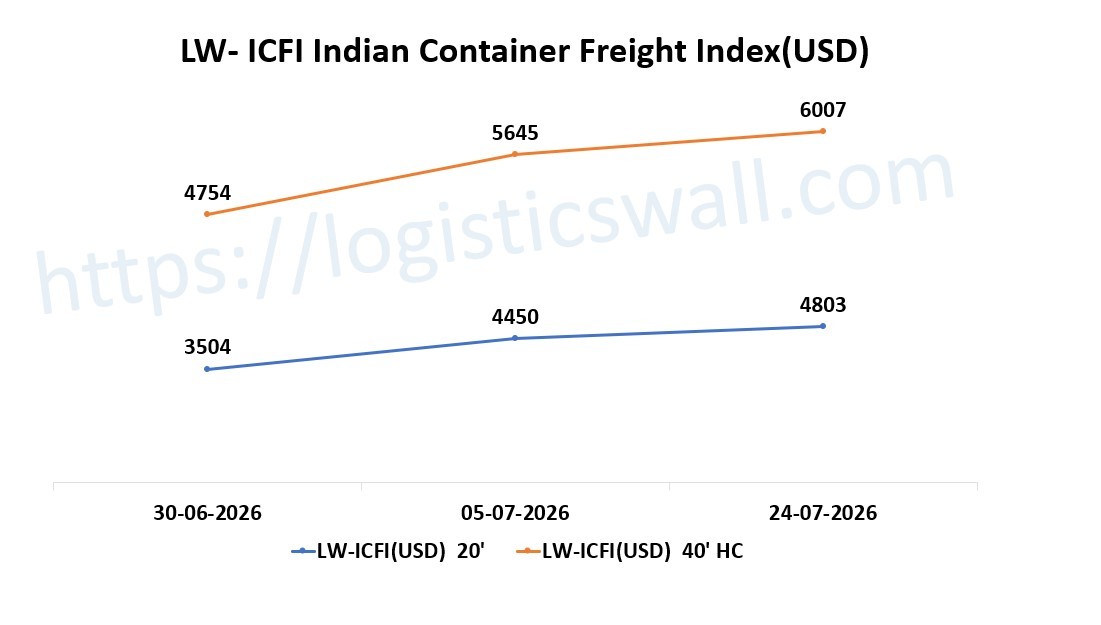
According to the latest LW-ICFI assessment, the benchmark for 20GP containers increased to USD 4,803 per container on 24 July 2026, while the 40'/40HC benchmark reached USD 6,007 per container. Compared with the initial assessment on 30 June 2026, the benchmark recorded an increase of 37.1% for 20GP containers and 26.4% for 40'/40HC containers, highlighting the continued tightening of container shipping capacity serving Indian exports.
Unlike global freight benchmarks that primarily publish 40-foot container rates, LW-ICFI separately tracks both 20GP and 40'/40HC containers, providing a more representative picture of India's export market where a significant proportion of commodities—including minerals, metals, chemicals, agricultural products, stone products and engineering cargo—continue to move in 20-foot containers.
LW-ICFI Benchmark (USD) | ||
Date | 20' | 40' HC/40’ |
30-06-2026 | 3504 | 4754 |
05-07-2026 | 4450 | 5645 |
24-07-2026 | 4803 | 6007 |
Market performance
Period | 20GP | 40'/40HC |
30 Jun – 05 Jul | 27.00% | 18.70% |
05 Jul – 24 Jul | 7.90% | 6.40% |
Overall | 37.10% | 26.40% |
The latest assessment indicates that freight inflation has been particularly pronounced for 20’ containers, reflecting stronger demand for equipment used in commodity exports and heavier cargoes.
Trade lane assessment
Trade Lanes (Weighted Average) | LW-ICFI on 24-07-2026 | |
20' | 40' HC / 40’ | |
Middle East (25%) | 3823 | 5140 |
North Europe (25%) | 4739 | 5773 |
Mediterranean (15%) | 4701 | 5847 |
North America (25%) | 5872 | 7297 |
West Africa (5%) | 9153 | 10701 |
Far East (5%) | 635 | 841 |
LW-ICFI currently covers six principal export corridors representing the majority of India's containerised exports.
North America continued to record the highest freight levels among the major long-haul trades, while West Africa remained the most expensive corridor due to limited direct services and comparatively lower capacity. The Far East trade recorded the lowest benchmark freight rates owing to shorter transit distances and greater service frequency.
How LW-ICFI is calculated
LW-ICFI follows a transparent, multi-stage weighted average methodology designed to reflect the structure of India's export container market.
The benchmark is derived through:
Freight collection from multiple shipping lines, NVOCCs and market participants.
Regional weighted averages based on India's major export gateways.
Destination port weightages within each trade lane.
Trade lane weightages reflecting India's export distribution.
Consolidation into separate national benchmarks for 20GP and 40'/40HC containers.
Regional weightages
Region | Weight |
West India | 72% |
South India | 22% |
East India | 6% |
The regions include below ports and the weighted average share has been derived on basis of container handled by each port (to get monthly port traffic data please click here.
East India share of 6% includes ports of Kolkata / Haldia / Paradip / Visakhapatnam / Gangavaram
South India share of 22% includes ports of Kattupalli / Chennai / Tuticorin / Ennore / Kakinada / Cochin / Vizhinjam
West India share of 72% includes ports of Pipavav / Hazira / Mundra / Kandla / Nhava Sheva / Mangalore
Trade lane weightages
Trade Lane | Weight |
Middle East | 25% |
North Europe | 25% |
North America | 25% |
Mediterranean | 15% |
West Africa | 5% |
Far East | 5% |
The benchmark incorporates freight assessments from representative Indian export gateways and major destination ports, using weighted averages to reflect prevailing market conditions. Freight quotations from leading shipping lines, NVOCCs and other market participants are consolidated through a structured methodology to produce a single national benchmark for each equipment type.
About LW-ICFI
The LogisticsWall Indian Container Freight Index (LW-ICFI) is an independent benchmark developed to measure prevailing container freight rates for India's export trade.
The benchmark is published separately for 20GP and 40'/40HC containers in USD per container and is intended to provide exporters, shipping lines, freight forwarders, logistics service providers, financial institutions, researchers and policymakers with a transparent reference for monitoring changes in Indian export freight markets.
The methodology will be reviewed periodically to ensure that the benchmark continues to reflect evolving trade patterns while maintaining consistency and comparability across reporting periods.
Just for better clarity below is an example how the index is derived for Middle East
Trade lanes ( Wtd. Avg) | Destinations (Wtd. Avg) freight in USD | Line (Wtd. avg %) | East India | South India | West India | |||
20' | 40' HC | 20' | 40' HC | 20' | 40' HC | |||
Middle East (25%) | Jebel Ali (40%) | MSC (20%) | 4513 | 5513 | 4313 | 5313 | 3513 | 4513 |
| Maersk (10%) | 5500 | 6500 | 5300 | 6300 | 4500 | 5500 | |
| CMA (13%) | 5600 | 7100 | 5400 | 6900 | 4600 | 6100 | |
| Others (57%) | 4500 | 5500 | 4300 | 5300 | 2700 | 4800 | |
Sohar (10%) | MSC (20%) | 3563 | 4563 | 3363 | 4363 | 2563 | 3563 | |
| Maersk (10%) | 4500 | 6000 | 4300 | 5800 | 3500 | 5000 | |
| CMA (13%) | 5600 | 6600 | 5400 | 6400 | 4600 | 5600 | |
| Others (57%) | 4500 | 5600 | 4300 | 5400 | 3500 | 4600 | |
Jeddah (50%) | MSC (20%) | 4213 | 5413 | 4013 | 5213 | 3213 | 4413 | |
| Maersk (10%) | 6000 | 7000 | 5800 | 6800 | 5000 | 6000 | |
| CMA (13%) | 5700 | 6700 | 5500 | 6500 | 4700 | 5700 | |
| Others (57%) | 4500 | 6500 | 4300 | 6300 | 3500 | 4500 | |
For Middle East the major ports included are Jebel Ali / Sohar /Jeddah ( as other port movement is hindered now due to war in strait of Hormuz)
Below freight index details of each destination port was derived from different regions of India
Ports (Wtd. Avg) | East India (6%) | South India (22%) | West India (72%) | |||
Destinations (Wtd. Avg) | 20' | 40' HC | 20' | 40' HC | 20' | 40' HC |
Jebel Ali (40%) | 4746 | 5811 | 4546 | 5611 | 3290 | 4982 |
Sohar (10%) | 4456 | 5563 | 4256 | 5363 | 3456 | 4563 |
Jeddah (50%) | 4749 | 6359 | 4549 | 6159 | 3749 | 4789 |
For Middle East the freight index from different Indian regions was derived as destination port weighted average
Ports (Wtd. Avg) | East India (6%) | South India (22%) | West India (72%) | |||
20' | 40' HC | 20' | 40' HC | 20' | 40' HC | |
Middle East | 4718 | 6060 | 4518 | 5860 | 3536 | 4843 |
After taking share of weighted average of each Indian port the Index for Middle East was arrived for 20’ & 40HC/40’ with below data and the all trade data is mentioned above in trade lane assessment.
Trade Lanes (Weighted Average) | LW-ICFI | |
20' | 40' HC/40’ | |
Middle East (25%) | 3823 | 5140 |
As explained above after taking the weighted average of all the trade lanes the Indian Container freight index is derived with below data
LW- ICFI | ||
Date | 20' | 40' HC/40’ |
24-07-2026 | 4803 | 6007 |
Regional freight normalisation methodology
Freight rates vary slightly between Indian ports within the same region due to differences in terminal charges, feeder connectivity, vessel calls and market dynamics. To ensure that the LW-ICFI accurately reflects regional freight levels, appropriate freight adjustments have been applied where necessary.
East India
Freight from Paradip is generally USD 50 per container higher than Kolkata/Haldia.
Freight from Visakhapatnam (Vizag) and Gangavaram is typically USD 50 per container higher than Paradip.
These adjustments apply to both 20GP and 40'/40HC containers.
West India
Freight rates from Mundra and Nhava Sheva (JNPA) are generally comparable for long-haul trade lanes such as Europe, North America and Africa.
For Middle East destinations, freight from Mundra is typically USD 50–100 per container lower than Nhava Sheva for both 20GP and 40'/40HC containers.
South India
Freight from Tuticorin (V.O. Chidambaranar Port) and Cochin is generally USD 50–100 per container higher than Chennai and Kattupalli for long-haul trade lanes.
These adjustments apply to both 20GP and 40'/40HC containers.
Methodological notes
40' or 40HC freight represents both 40-foot General Purpose (40GP) and 40-foot High Cube (40HC) containers, as market freight levels for these equipment types are mostly same.
Freight rates for Antwerp and Rotterdam are considered substantially similar for the purpose of the index and are treated accordingly in the weighted-average calculations.
The index uses representative major Indian ports as reference gateways. Freight levels for nearby ports with similar market characteristics are derived from these representative ports using appropriate regional adjustments.
These normalisation adjustments are based on prevailing market observations and are applied solely to ensure that the LW-ICFI reflects representative freight levels across India's principal export regions.
Key drivers behind the increase in freight rates
The rise in Indian export container freight rates has been driven by a combination of supply-side constraints and operational disruptions affecting global liner shipping networks.
1. Forward loading ahead of peak season in China
Shipping lines have accelerated vessel deployment towards China in preparation for the traditional peak export season. The repositioning of vessel capacity has reduced the availability of slots on several Indian export services, particularly on long-haul routes to Europe and North America.
The resulting reduction in effective capacity has increased competition for export space from Indian ports, placing upward pressure on freight rates.
2. Congestion at major transshipment hubs
Persistent congestion at key Asian transshipment ports, particularly Singapore and Colombo, has created significant operational bottlenecks across regional shipping networks. The congestion started in March with the beginning of the war in Strait of Hormuz and the backlog is still pertaining and creating bull whip effect.
3. Geopolitical tensions in the Middle East
Continuing conflict in the Middle East has added further uncertainty to global shipping operations.
Popular Posts

Explore Topics



Comments