
LW-ICFI LogisticsWall Indian Container Freight Index for ocean exports for Aug 2026

India's container export market has entered August with another sharp increase in freight costs, led by a particularly strong rise in 20-foot equipment.
The LogisticsWall Indian Container Freight Index (LW-ICFI) stood at $5,804 per 20GP container and $6,343 per 40'/40HC container on 9 August 2026, according to the latest LogisticsWall assessment.
Compared with the previous assessment on 24 July, the 20GP benchmark increased by 20.8%, while the 40'/40HC benchmark rose by 5.6%. The divergence between the two equipment types is significant: demand for 20-foot equipment is rising faster, particularly across India's commodity-heavy export base.
The latest assessment also indicates that space availability has improved somewhat from July, but this has not yet translated into lower overall freight levels.
Below is the present trend and the expected increase in freight in coming month till October 2026.
The freight is expected to increase in coming one month due to forward loading from China and then it is expected to reduce from October.
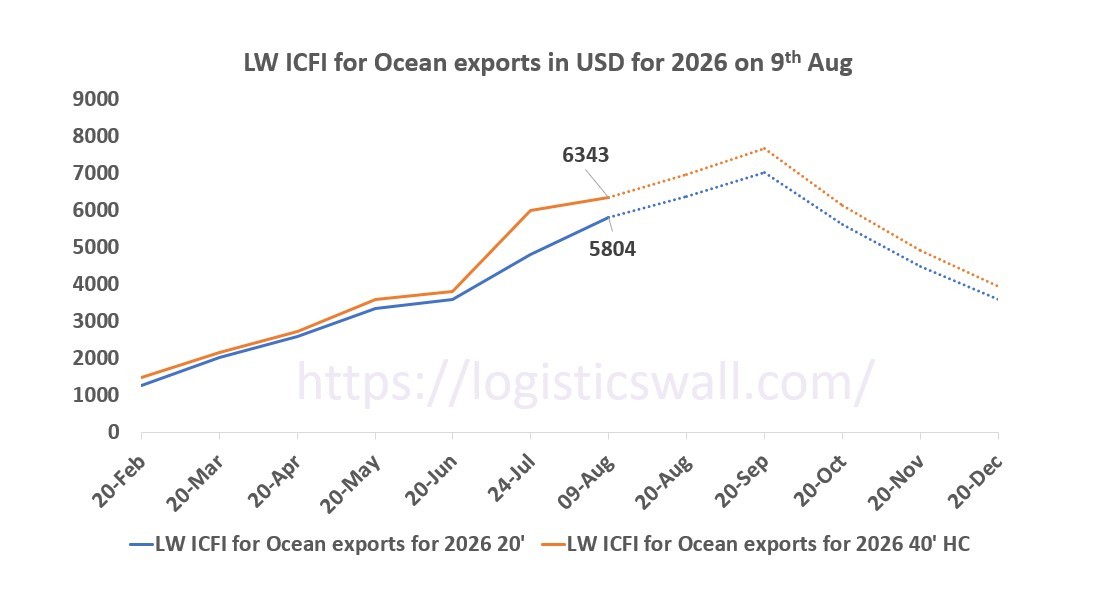
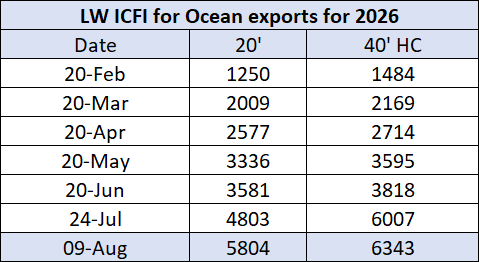
The latest move is notable because 20GP freight has risen by more than $1,000 per container since the July 24 assessment.
The pattern suggests that equipment availability and cargo mix are becoming increasingly important to the Indian export market. A substantial share of India's containerised exports consists of minerals, metals, chemicals, agricultural products, stone products and engineering cargo, where 20-foot equipment is widely used
Trade lane assessment
Europe and North America remain under pressure. The strongest freight pressure is visible on long-haul trades.
The 9 August LW-ICFI trade-lane assessment places North America at $8,973 for 20GP and $8,852 for 40'/40HC, making it the highest-priced major corridor in the index.
North Europe follows at $5,820 for 20GP and $6,414 for 40'/40HC, while the Mediterranean stands at $5,375 and $5,875, respectively.
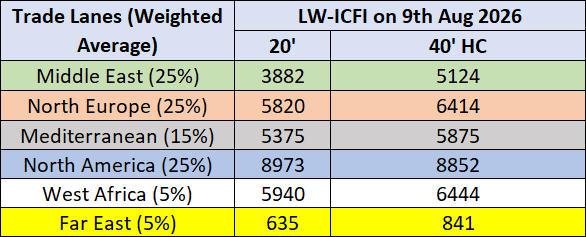
LW-ICFI currently covers six principal export corridors representing the majority of India's containerised exports.
The Far East remains the lowest-priced corridor in the assessment, reflecting shorter sailing distances and relatively frequent regional services.
Recent carrier pricing actions provide additional evidence of the upward pressure facing Indian exporters. Hapag-Lloyd announced higher India–North Europe and India–Mediterranean tariff levels effective August 1, including increases of $2,000 per container on selected services from Nhava Sheva and Mundra.
Maersk has also announced higher emergency contingency surcharges for Indian Subcontinent exports to North Europe and the Mediterranean from August 1, while separate peak-season surcharges have been applied on India and other Indian Subcontinent origins to the US West Coast.
Space availability improves, but rates remain elevated
Market feedback collected for the latest LW-ICFI assessment suggests that space availability has improved compared with July.
MSC has reopened bookings from a number of Indian ports, while CMA CGM and Hapag-Lloyd are also showing greater booking availability. Maersk's spot-booking position remains comparatively restrictive, according to the market assessment used in compiling the index.
The improvement in available space has not yet resulted in a corresponding decline in the national benchmark because carriers continue to manage capacity against strong demand on selected export corridors.
This distinction is important for exporters: better booking availability does not necessarily mean lower freight rates.
Forward loading could push rates higher before an October correction
The LW-ICFI outlook points to another increase over the next several weeks.
The current assessment projects the index at approximately:
20 August: $6,384 for 20GP and $6,977 for 40'/40HC
20 September: $7,022 and $7,675
20 October: $5,618 and $6,140
The expected August-September increase is linked to forward loading ahead of the Chinese peak export season, which could tighten available vessel capacity serving Indian export cargo.
The index currently projects a reversal from October as that pressure begins to ease.
These figures should be treated as LW-ICFI market projections rather than confirmed future freight rates. Actual carrier quotations can vary by port, destination, sailing, commodity, equipment availability, service contract and applicable surcharges.
Middle East disruption continues to affect network planning
The Indian export market is also operating against a highly disrupted global shipping environment.
The ongoing conflict around the Strait of Hormuz has affected vessel movements and shipping networks across the Middle East. As of August 9, the waterway remained effectively closed to normal commercial traffic, adding uncertainty to routing and capacity planning.
The disruption has also placed additional pressure on alternative maritime gateways and transshipment networks. Earlier disruptions have already affected major Asian hubs, including Singapore and Colombo, creating potential knock-on effects for container flows connected with the Indian market.
For Indian exporters, the result is not simply higher freight on Middle East cargo. Network changes can alter vessel deployment, transshipment patterns, equipment positioning and available capacity on unrelated long-haul services.
How LW-ICFI is calculated
LW-ICFI the Indian Container Freight Index for ocean exports follows a transparent, multi-stage weighted average methodology designed to reflect the structure of India's export container market.
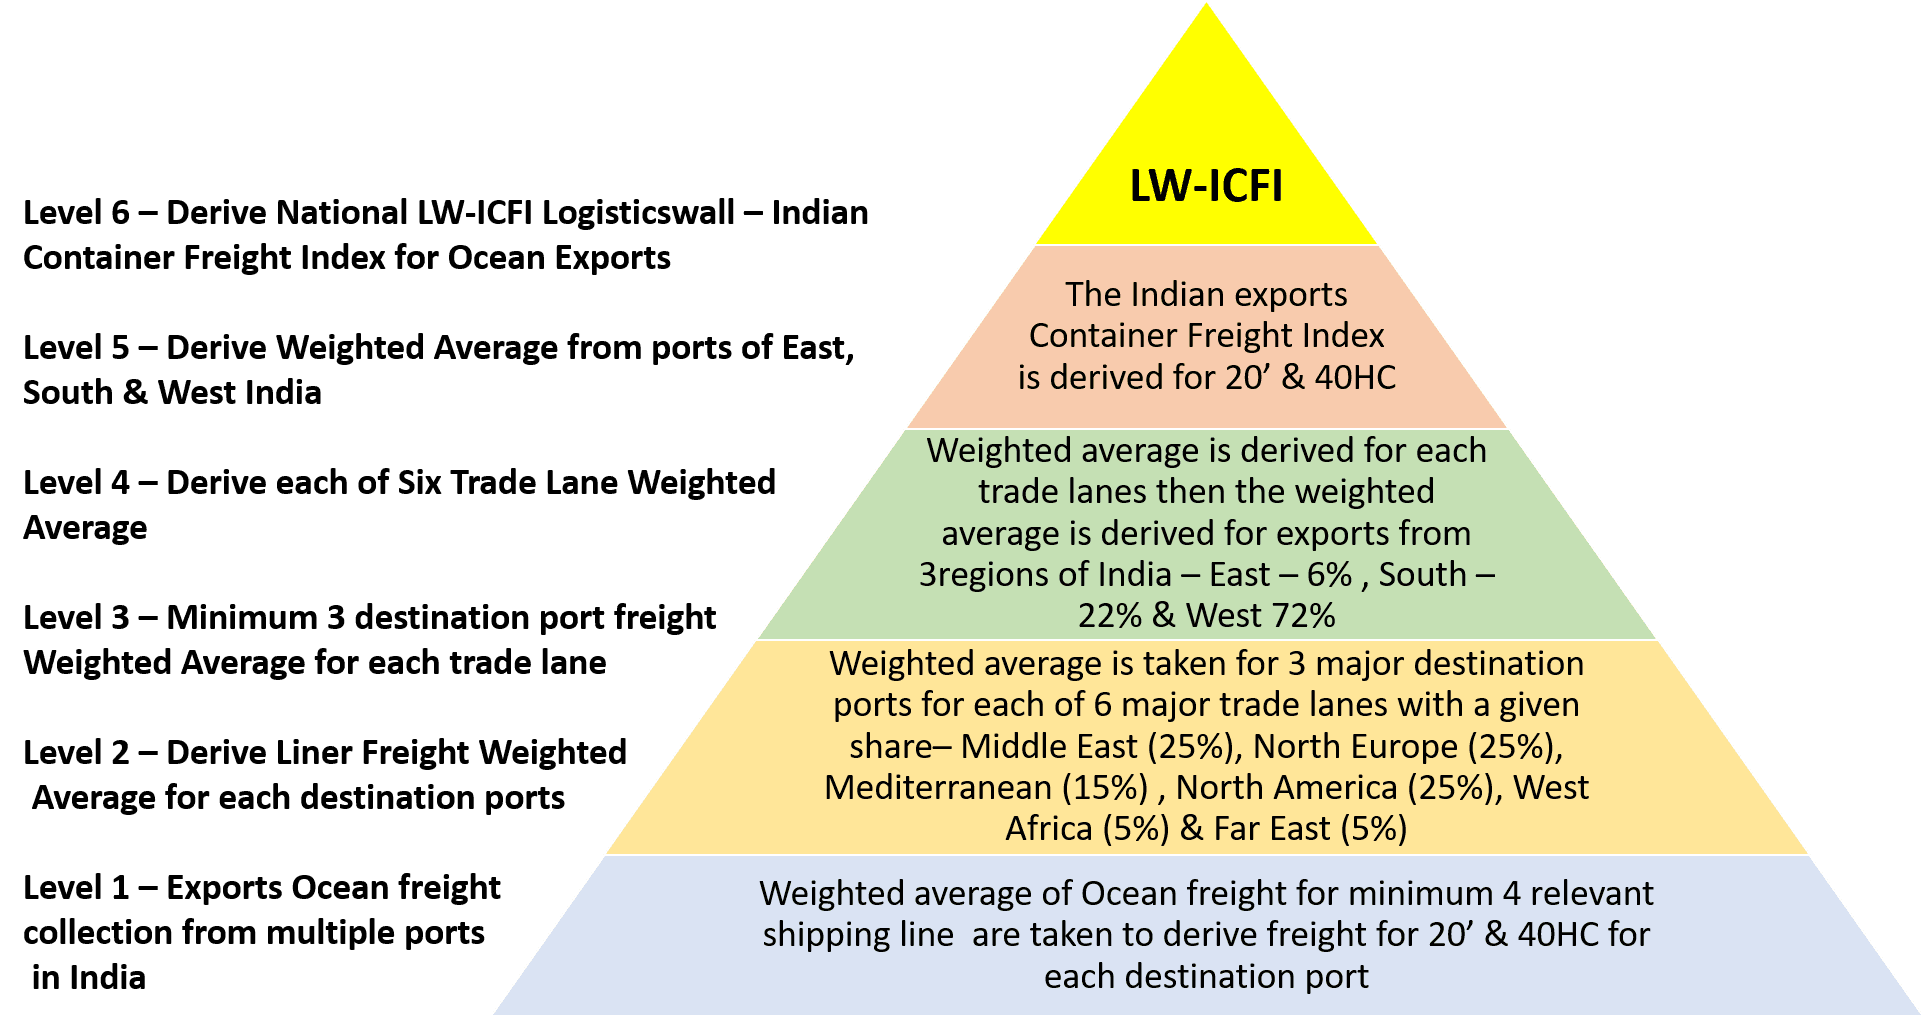
The benchmark is published separately for 20GP and 40'/40HC containers in USD per container and is intended to provide exporters, shipping lines, freight forwarders, logistics service providers, financial institutions, researchers and policymakers with a transparent reference for monitoring changes in Indian export freight markets.
The methodology will be reviewed periodically to ensure that the benchmark continues to reflect evolving trade patterns while maintaining consistency and comparability across reporting periods.
Just for better clarity below is an example how the index is derived for Middle East
Trade lanes ( Wtd. Avg) | Destinations(Wtd. Avg) | Line (Wtd avg %) | East India | South India | West India | |||
20' | 40' HC | 20' | 40' HC | 20' | 40' HC | |||
Middle East(25%) | Jebel Ali(40%) | MSC(20%) | 4263 | 5513 | 4063 | 5313 | 3263 | 4233 |
Maersk(10%) | 5500 | 6500 | 5300 | 6300 | 4500 | 5500 | ||
CMA)13%) | 5100 | 7100 | 4900 | 6900 | 4100 | 6100 | ||
Others (57%) | 5500 | 5500 | 5300 | 5300 | 2700 | 4800 | ||
Sohar(10%) | MSC(20%) | 3663 | 4563 | 3463 | 4363 | 2663 | 3563 | |
Maersk(10%) | 4300 | 6000 | 4100 | 5800 | 3300 | 5000 | ||
CMA)13%) | 5600 | 6600 | 5400 | 6400 | 4600 | 5600 | ||
Others (57%) | 4500 | 5600 | 4300 | 5400 | 3500 | 4600 | ||
Jeddah(50%) | MSC(20%) | 4800 | 5413 | 4600 | 5213 | 3800 | 4413 | |
Maersk(10%) | 6100 | 7000 | 5900 | 6800 | 5100 | 6000 | ||
CMA)13%) | 5600 | 6700 | 5400 | 6500 | 4600 | 5700 | ||
Others (57%) | 4300 | 6500 | 4100 | 6300 | 3500 | 4500 | ||
For Middle East the major ports included are Jebel Ali / Sohar /Jeddah ( as other port movement is hindered now due to war in strait of Hormuz)
Below freight index details of each destination port was derived from different regions of India
Ports( Wtd. Avg) | East India (6%) | South India(22%) | West India(72%) | |||
Destinations(Wtd. Avg) | 20' | 40' HC | 20' | 40' HC | 20' | 40' HC |
Jebel Ali(40%) | 5201 | 5811 | 5001 | 5611 | 3175 | 4926 |
Sohar(10%) | 4456 | 5563 | 4256 | 5363 | 3456 | 4563 |
Jeddah(50%) | 4749 | 6359 | 4549 | 6159 | 3863 | 4789 |
For Middle East the freight index from different Indian regions was derived as destination port weighted average
Ports (Wtd. Avg) | East India (6%) | South India(22%) | West India(72%) | |||
20' | 40' HC | 20' | 40' HC | 20' | 40' HC | |
Middle East | 4900 | 6060 | 4700 | 5860 | 3547 | 4821 |
After taking share of weighted average of each Indian port the Index for Middle East and other trade lanes were arrived for 20’ & 40HC/40’ with below data and the all trade data is mentioned above in trade lane assessment.
Trade Lanes (Weighted Average) | LW-ICFI on 9th Aug 2026 | |
20' | 40' HC | |
Middle East (25%) | 3882 | 5124 |
North Europe (25%) | 5820 | 6414 |
Mediterranean (15%) | 5375 | 5875 |
North America (25%) | 8973 | 8852 |
West Africa (5%) | 5940 | 6444 |
Far East (5%) | 635 | 841 |
As explained above after taking the weighted average of all the trade lanes the Indian Container freight index is derived with below data
LW-ICFI on 09-08-2026 | ||
Date | 20' | 40' HC |
09-08-2026 | 5804 | 6343 |
Regional freight normalisation methodology
Freight rates vary slightly between Indian ports within the same region due to differences in terminal charges, feeder connectivity, vessel calls and market dynamics. To ensure that the LW-ICFI accurately reflects regional freight levels, appropriate freight adjustments have been applied where necessary.
East India
Freight from Paradip is generally USD 50 per container higher than Kolkata/Haldia.
Freight from Visakhapatnam (Vizag) and Gangavaram is typically USD 50 per container higher than Paradip.
These adjustments apply to both 20GP and 40'/40HC containers.
West India
Freight rates from Mundra and Nhava Sheva (JNPA) are generally comparable for long-haul trade lanes such as Europe, North America and Africa.
For Middle East destinations, freight from Mundra is typically USD 50–100 per container lower than Nhava Sheva for both 20GP and 40'/40HC containers.
South India
Freight from Tuticorin (V.O. Chidambaranar Port) and Cochin is generally USD 50–100 per container higher than Chennai and Kattupalli for long-haul trade lanes.
These adjustments apply to both 20GP and 40'/40HC containers.
Methodological notes
40' or 40HC freight represents both 40-foot General Purpose (40GP) and 40-foot High Cube (40HC) containers, as market freight levels for these equipment types are mostly same.
Freight rates for Antwerp and Rotterdam are considered substantially similar for the purpose of the index and are treated accordingly in the weighted-average calculations.
The index uses representative major Indian ports as reference gateways. Freight levels for nearby ports with similar market characteristics are derived from these representative ports using appropriate regional adjustments.
These normalisation adjustments are based on prevailing market observations and are applied solely to ensure that the LW-ICFI reflects representative freight levels across India's principal export regions.
Key drivers behind the increase in freight rates
The rise in Indian export container freight rates has been driven by a combination of supply-side constraints and operational disruptions affecting global liner shipping networks.
1. Forward loading ahead of peak season in China
Shipping lines have accelerated vessel deployment towards China in preparation for the traditional peak export season. The repositioning of vessel capacity has reduced the availability of slots on several Indian export services, particularly on long-haul routes to Europe and North America.
The resulting reduction in effective capacity has increased competition for export space from Indian ports, placing upward pressure on freight rates.
2. Congestion at major transshipment hubs
Persistent congestion at key Asian transshipment ports, particularly Singapore and Colombo, has created significant operational bottlenecks across regional shipping networks. The congestion started in March with the beginning of the war in Strait of Hormuz and the backlog is still pertaining and creating bull whip effect.
3. Geopolitical tensions in the Middle East
Continuing conflict in the Middle East has added further uncertainty to global shipping operations.
What the August index means for exporters
The latest LW-ICFI reading points to a market where freight inflation is becoming increasingly concentrated in 20-foot equipment, while long-haul destinations remain exposed to capacity and surcharge pressures.
For exporters, the immediate challenge is therefore not simply securing a booking. It is securing the required equipment and space at a freight level that remains commercially viable.
The next two assessments will be particularly important. If forward loading continues to absorb available capacity, the index could move towards the projected September peak. Conversely, a meaningful improvement in vessel availability, equipment supply or demand conditions could accelerate the expected correction from October.
LW-ICFI will continue to track these movements through its next assessment.
Popular Posts


Explore Topics



Comments